Google Classroom
Google Classroom
GeoGebra
GeoGebra Classroom
Abrir sesión
Buscar
Google Classroom
Google Classroom
GeoGebra
GeoGebra Classroom
Esquema
AS Statistics
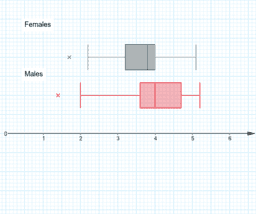
Box plots: page 44, example 3
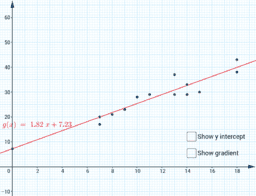
Correlation: page 64, example 3
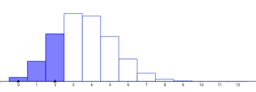
Statistical distributions: page 93, example 7
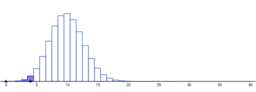
Hypothesis testing: page 103, example 4
AS Statistics
Autor:
monicaphillips37
Tema:
Estadística
Box plots: page 44, example 3
Correlation: page 64, example 3
Statistical distributions: page 93, example 7
Hypothesis testing: page 103, example 4
Siguiente
Box plots: page 44, example 3
Nuevos recursos
Cartesian vs Polar
z`]]
apec
רישום חופשי
bewijs stelling van Pythagoras
Descubrir recursos
College Algebra
Türeve Giriş – Eğim Fonksiyonu
Exploring Dilations
task 1
Simular Triangles
Descubre temas
Diagrama de cajas
Exponente
Triángulos
Prisma
Traslación