Google Classroom
Google Classroom
GeoGebra
GeoGebra Classroom
Abrir sesión
Buscar
Google Classroom
Google Classroom
GeoGebra
GeoGebra Classroom
Esquema
Correlation Coefficient Discovery Graphs
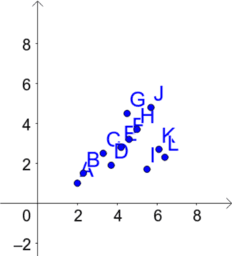
Discovering Correlation Coefficient Scatter Plots
Correlation Coefficient Discovery Graphs
Autor:
ShawnFowers
Tema:
Correlación
,
Estadística
Group of graphs to be used in conjunction with Correlation Coefficient Discovery lesson.
Discovering Correlation Coefficient Scatter Plots
Siguiente
Discovering Correlation Coefficient Scatter Plots
Nuevos recursos
Untitled
Angle Addition: Warm Up Exercises
Hyperbolic Paraboloid
Cartesian vs Polar
רישום חופשי
Descubrir recursos
this is a test
dfg dfgdgd dgdfg
nope
rotation matrix
Keeping the Equation Balanced: IM 8.4.2
Descubre temas
Funciones
Inecuaciones
Gráfica de Funciones
Curvas paramétricas
Cálculo diferencial