Google Classroom
Google Classroom
GeoGebra
Classe GeoGebra
Se connecter
Chercher
Google Classroom
Google Classroom
GeoGebra
Classe GeoGebra
Contenu
Statistics
Stem and Leaf Plot
Mean, Median, Mode
Two Way Tables
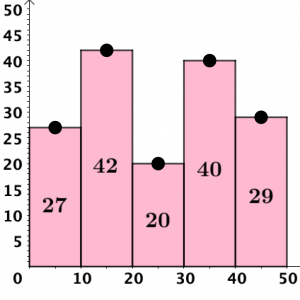
Histograms
Standard Deviation
Box and Whisker
Statistics
Auteur :
Tim Brzezinski
Thème :
Statistiques
Here, a growing volume of statistics resources.
Table des matières
Stem and Leaf Plot
Stem and Leaf Plot: Quick Illustrator
Mean, Median, Mode
Mean, Median, Mode, Range: Quick Check
Open Middle: Basic Statistics Exercise (1)
Two Way Tables
Open Middle: Two Way Table Setups
Open Middle: Two Way Table (2)
Open Middle: Two Way Table (3)
Histograms
Modifiable Histogram
Histogram: Warm Up Exercises (1)
Histogram: Warm Up Exercises (2)
Frequency vs. Relative Frequency Histograms
Open Middle Histogram Exercise (1)
Open Middle Histogram Exercise (2)
Standard Deviation
Standard Deviation Intro
Unusual Values and Outliers
Box and Whisker
Open Middle: Basic Statistics Exercise (2)
Box and Whisker Plot: What Do You Notice?
Box and Whisker: Quick Construction Exercises
Suivant
Stem and Leaf Plot: Quick Illustrator
Nouvelles ressources
巧算長方形周界
အခြေခံ data အခေါ်အဝေါ်များ
Tangent Plane to a Sphere
Parallel lines, Transversals and Segments
Text with alpha background color
Découvrir des ressources
lieusimpleBUG
Parallel Lines Exploration
PID1
Comparing Areas
pattern and tiles
Poisson-Binomial-Normal
Deling, brøk og tallinja
Découvrir des Thèmes
Figures Planes
Corrélation
Pavé Droit
Diagrammes
Triangles Semblables