Google Classroom
Google Classroom
GeoGebra
GeoGebra Classroom
Abrir sesión
Buscar
Google Classroom
Google Classroom
GeoGebra
GeoGebra Classroom
Esquema
Beschreibende Statistik
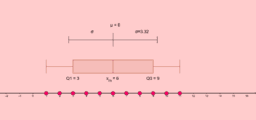
Vergleich statistischer Kennzahlen der Lage bzw. Streuung
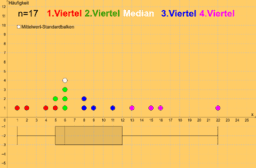
Boxplot: Datenaufteilung in Farbe
Beschreibende Statistik
Autor:
Gabriele Jauck
Tema:
Estadística
Vergleich statistischer Kennzahlen der Lage bzw. Streuung
Boxplot: Datenaufteilung in Farbe
Siguiente
Vergleich statistischer Kennzahlen der Lage bzw. Streuung
Nuevos recursos
Match it! Graph & Term
Erdbeeren pflücken mit Maria
Steigung und Steigungsdreieck
outfitkeuze
Zahlenmauer - Brüche multiplizieren
Descubrir recursos
Federschmuck
Flächengleiche Dreiecke
Zwei Züge - Längenkontraktion und Zeitdilatation
kleiner Leistungsnachweis
Verschiebung der Sinusfunktion
Descubre temas
Rotación
Cálculo diferencial
Histograma
Parábola
Ángulos