Log ind
Søg
GeoGebra
Hjem
Materialer
Profil
Classroom
App Downloads
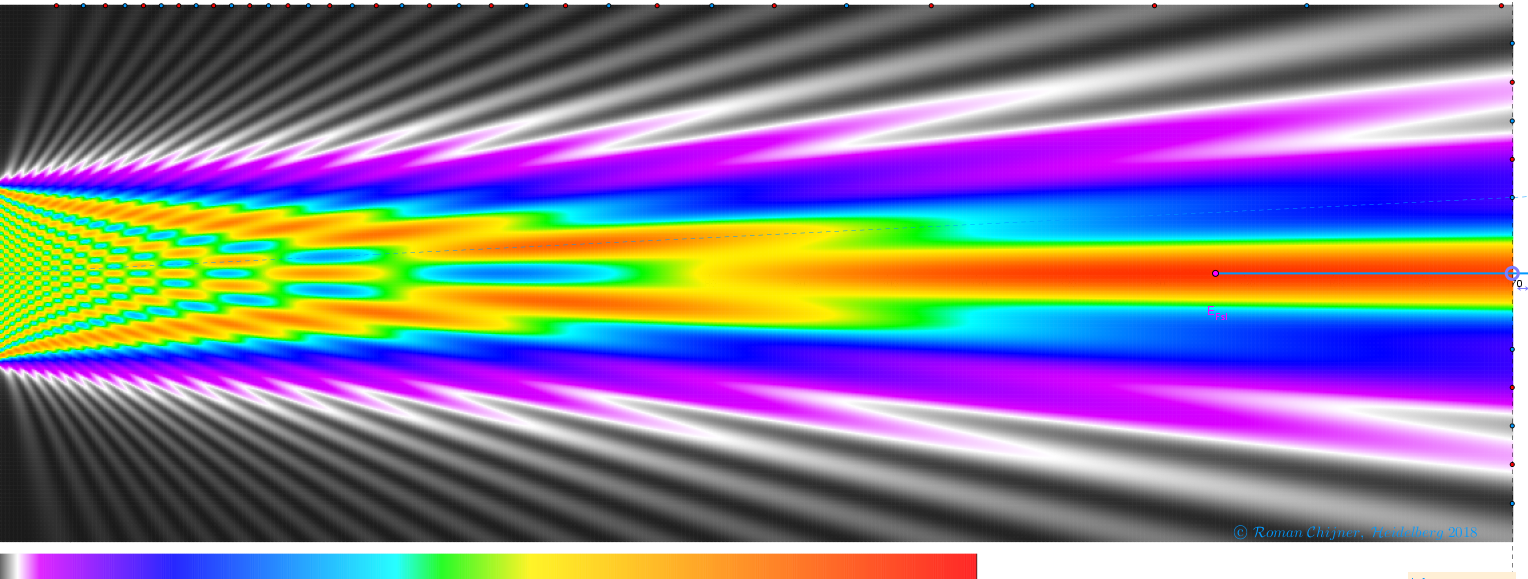
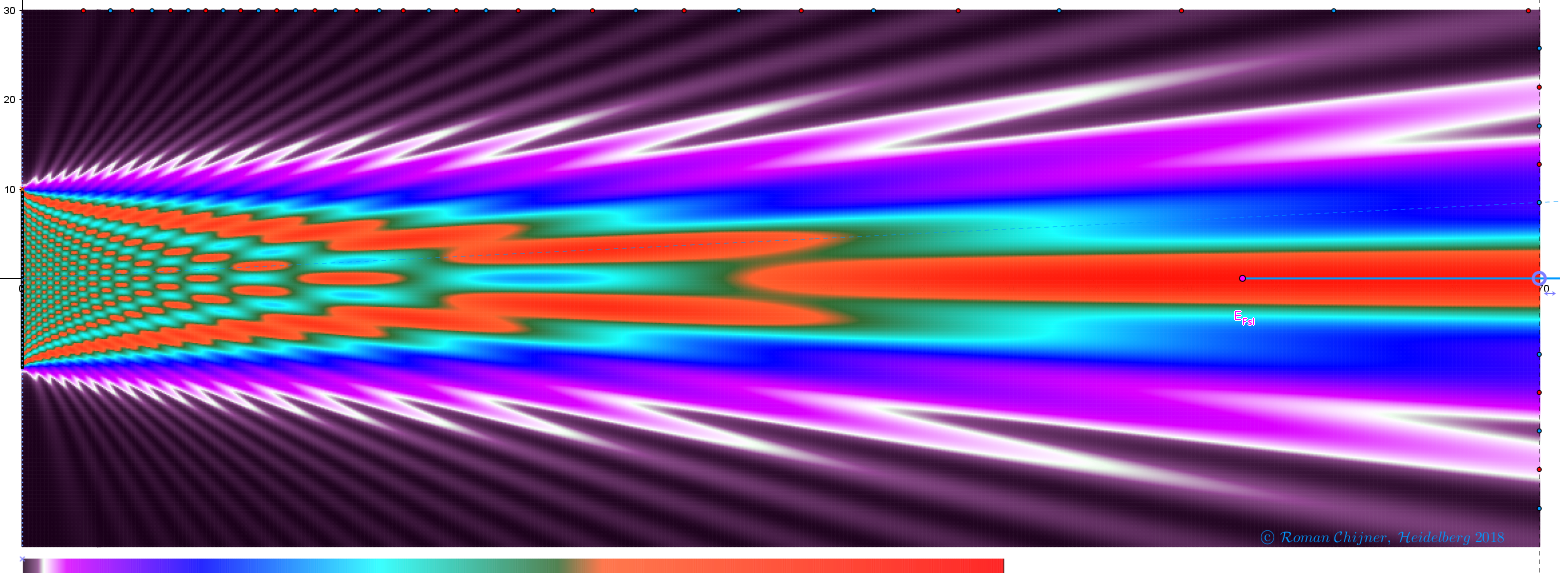
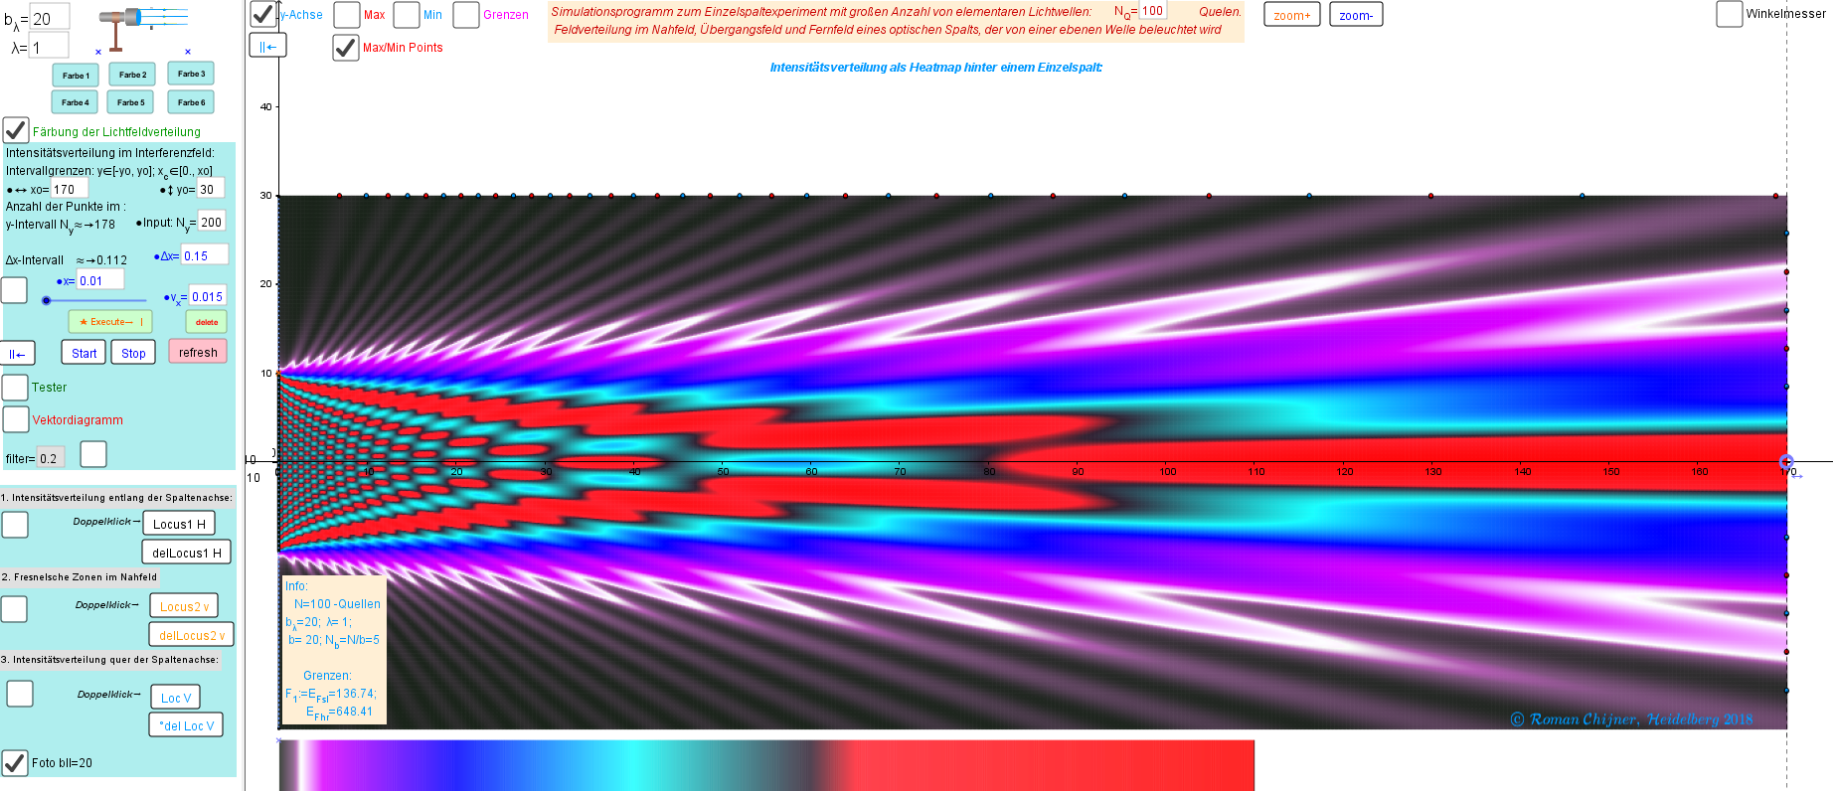
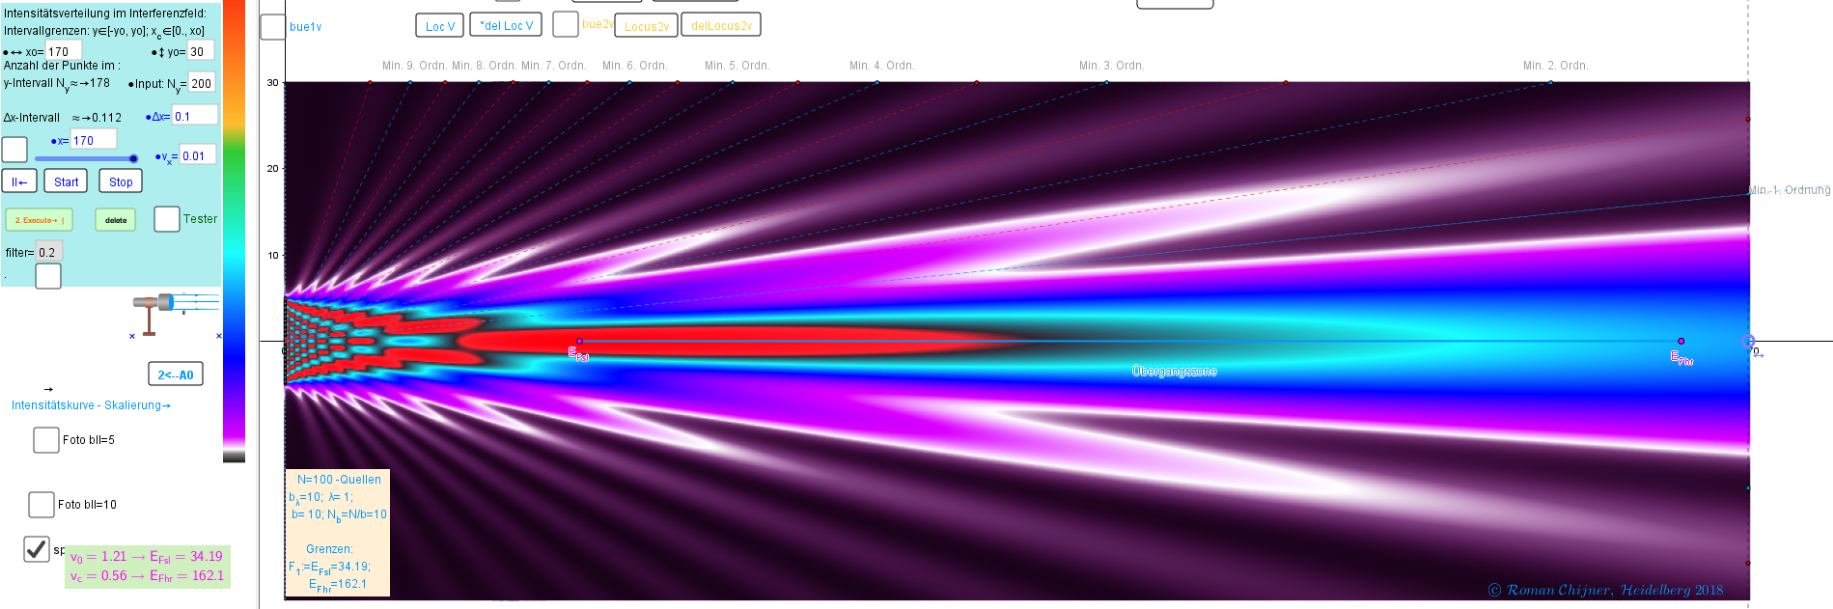
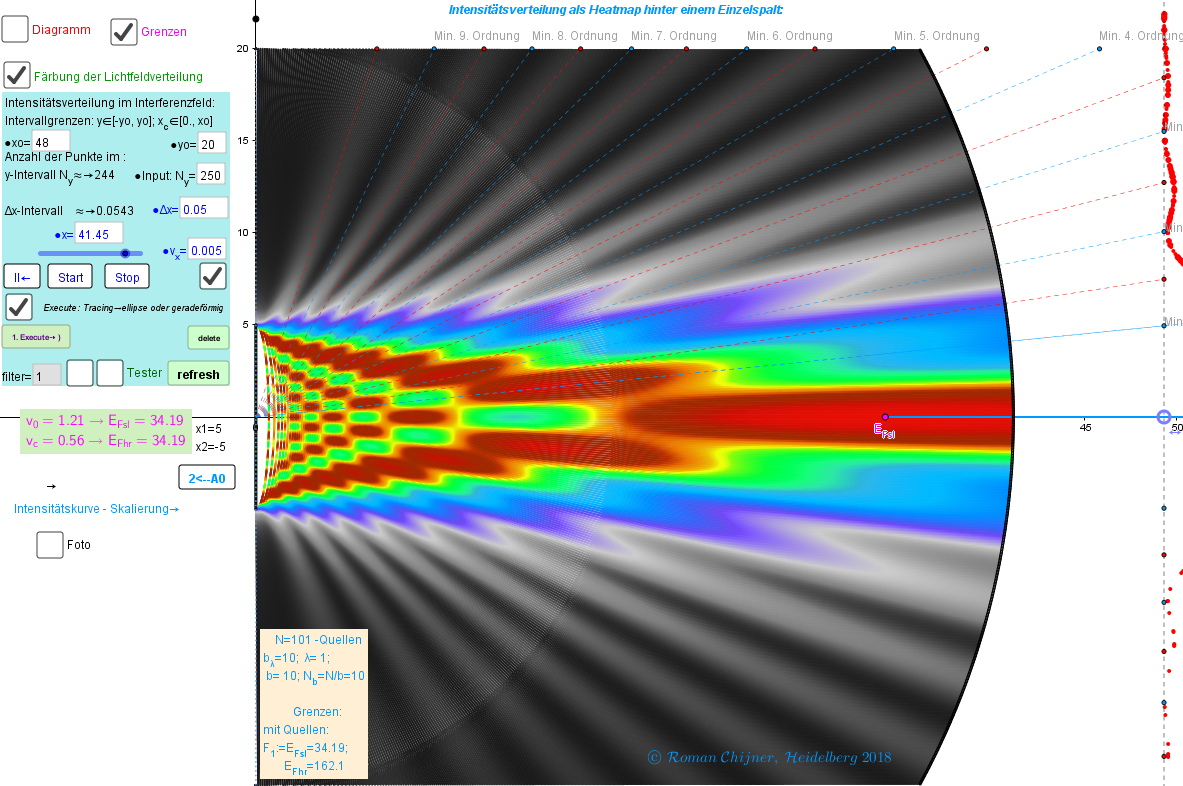
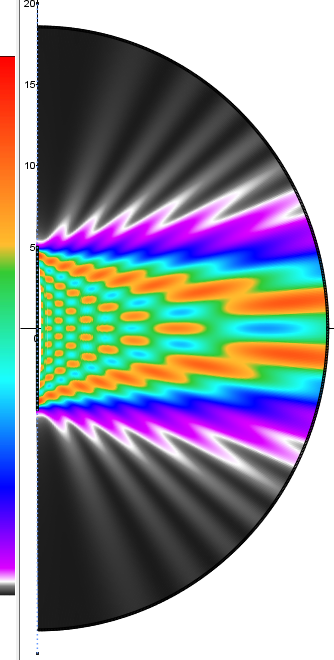
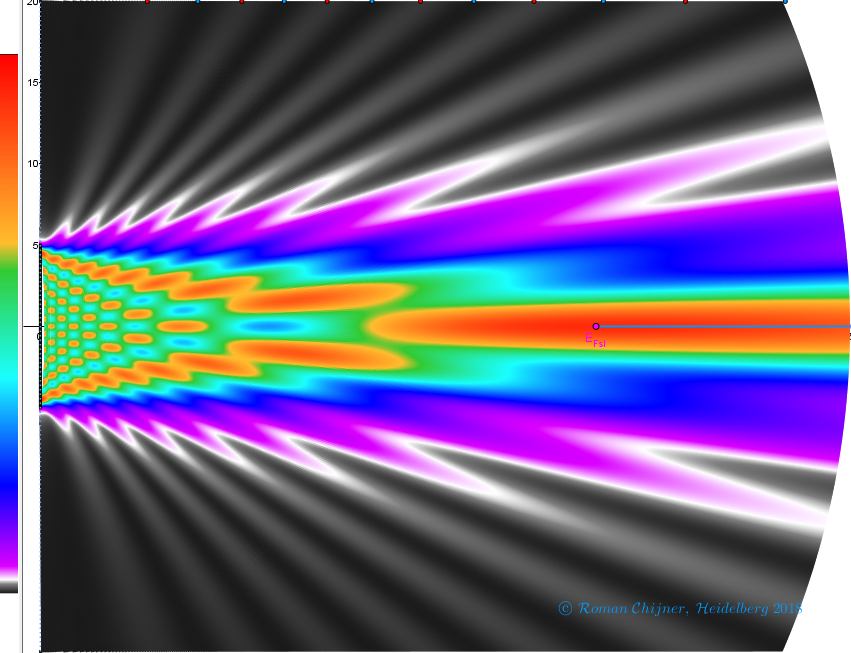
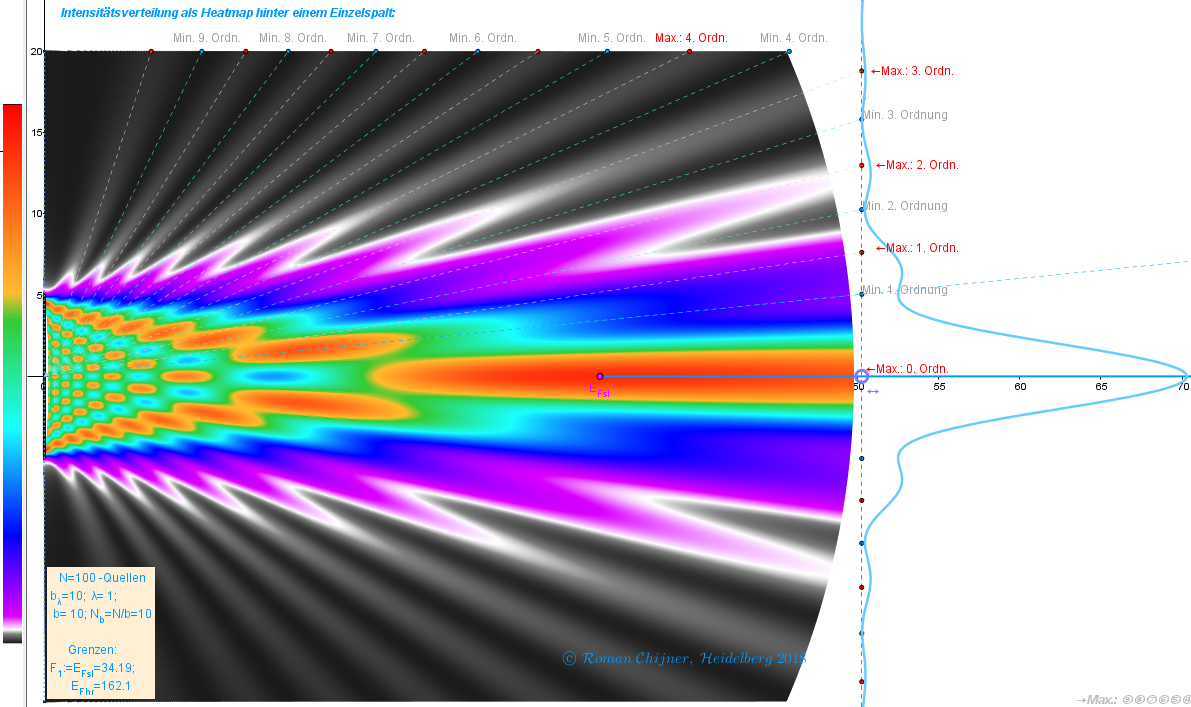
Bilder₂ zum Applet ●Heatmap hinter einem Einzelspalt, die als System von Punktquellen gedämpfter Wellen dargestellt wird.
Forfatter
Roman Chijner
Applet:
https://www.geogebra.org/m/dqyhaarg
b_λ=20, Farbe 6, N_Q=200
b_λ=20, Farbe 3, N_Q=200
b_λ=20, Farbe 2, N_Q=200
b_λ=10, Farbe 3, N_Q=200
b_λ=10, Farbe 1, N_Q=100
Nye Materialer
Fourier Lissajous (Mechanical)
Viviani's Curve
גיליון אלקטרוני להעלאת נתוני בעיה ויצירת גרף בהתאם
רישום חופשי
bewijs stelling van Pythagoras
Opdag Ressourcer
Step 1
segment Bisector
Finding Pi
Product Rule (Activity 12 HL)
Angle is a semi-circle
Udforsk emner
Boksplot
Plan
Brøker
Retvinklede trekanter
Differentialligninger