Google Classroom
Google Classroom
GeoGebra
GeoGebra Klaslokaal
Aanmelden
Zoek
Google Classroom
Google Classroom
GeoGebra
GeoGebra Klaslokaal
Overzicht
Graphs and Mapping Diagrams
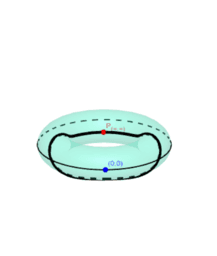
Graph of a function RP1 -> RP1
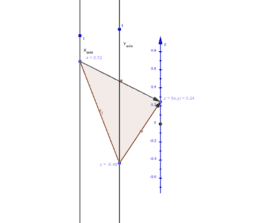
3 Dimensional Mapping Diagram for z= f(x,y)
Mapping Diagram of Function : RP1 to RP1
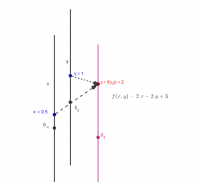
3D Mapping Diagram for linear z=f(x,y) with focus point
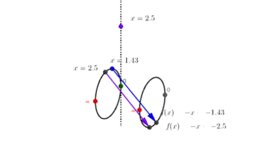
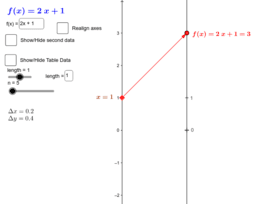
Graph w/ Mapping diagram: Estimating The Derivative
Mapping Diagrams (Real) Visualize Solving a Quadratic Equation
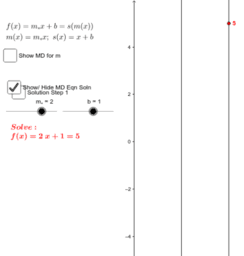
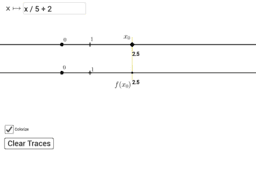
Mapping Diagrams To Visualize Solving a Linear Equation
Mapping Diagrams To Visualize Solving a Linear Equation
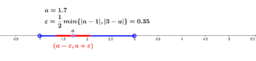
(a,b) is an open interval
Mapping Diagram, Spreadsheet, Graph, Realign, Focus
Visualizing Numeric Transformations
Graphs and Mapping Diagrams
Auteur:
Martin Flashman
Onderwerp:
Diagrammen
Visualizing Functions with Mapping Diagrams and Graphs. Functions defined on R and RP1=S1, the circle.
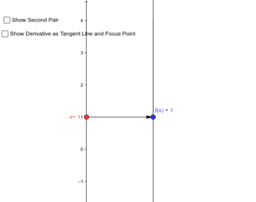
Graph of a function RP1 -> RP1
3 Dimensional Mapping Diagram for z= f(x,y)
Mapping Diagram of Function : RP1 to RP1
3D Mapping Diagram for linear z=f(x,y) with focus point
Graph w/ Mapping diagram: Estimating The Derivative
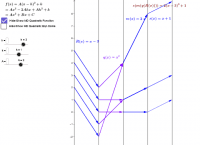
Mapping Diagrams (Real) Visualize Solving a Quadratic Equation
Mapping Diagrams To Visualize Solving a Linear Equation
Mapping Diagrams To Visualize Solving a Linear Equation
(a,b) is an open interval
Mapping Diagram, Spreadsheet, Graph, Realign, Focus
Visualizing Numeric Transformations
Volgende
Graph of a function RP1 -> RP1
Nieuw didactisch materiaal
Trefoil Knot
Model sferyczny - dwunastościan-dwudziestościan
¿Quién llegará más lejos en el mundial?
bewijs stelling van Pythagoras
Slope and Road Signs
Ontdek materiaal
School math olymp task in Russia
Start, equilateral triangle
Point of intersection
Ontdek onderwerpen
Oppervlak
Percentages
Parabool
Binomiale verdeling
Zwaartelijn