


Interpreting a Histogram About a Popcorn Party
Interpreting a Histogram About a Popcorn Party
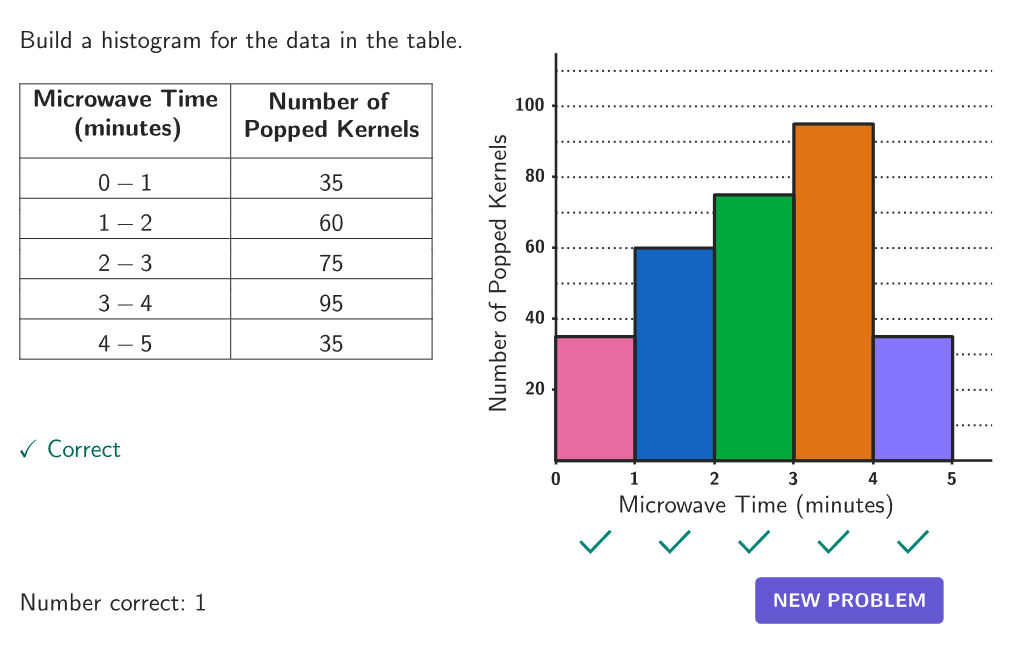
Let popcorn kernels pop and observe how the data is presented in a table and histogram. Interpret the distribution of the popped kernels.
Putting It All Together
Answer these open ended questions on your own or with others to form deeper math connections.
Open-ended question 1
Why do the bars for the “Number of Popped Kernels” start to go down?
Text and math input
Open-ended question 2
What does the “Number of Popped Kernels” represent?
Text and math input
Open-ended question 3
What do the heights of the bars tell you about the popcorn popping in the microwave?
Text and math input
Open-ended question 4
If some of the popcorn starts to burn at the end, at what time would you stop the microwave?
Text and math input
Open-ended question 5
If there were more kernels, how do you predict the histogram would change?
Text and math input
Explore more
Prerequisite Resources
More from Histograms