Diagrams
Learn and practice using various diagrams, such as histograms, box & whisker plots, scatter plots, line plots, dot plots, and frequency tables with interactive resources from GeoGebra.
Upper Elementary
GRADES 4-5
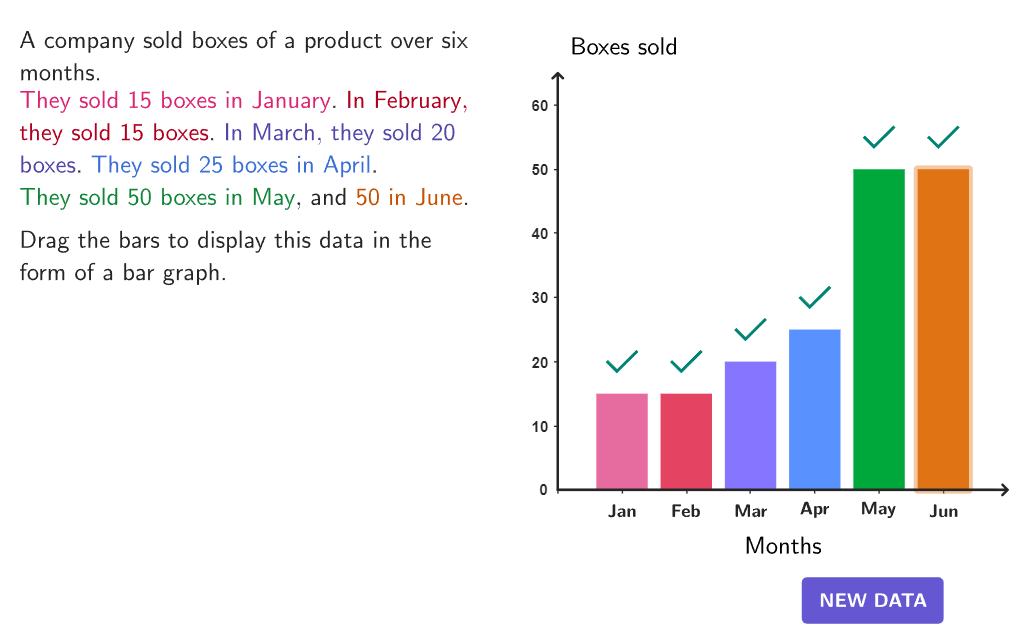
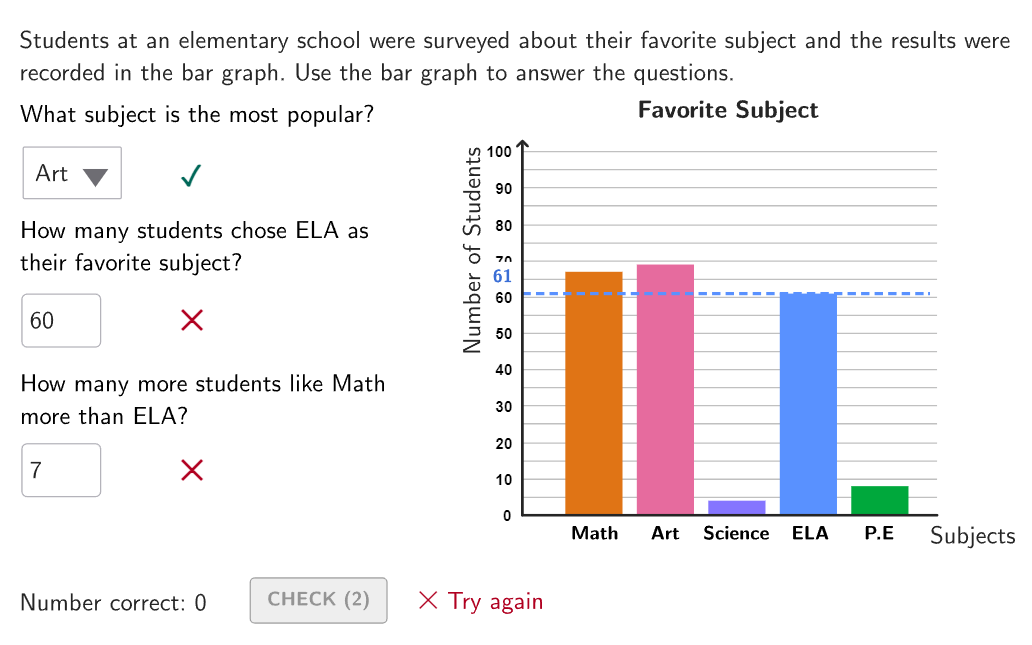
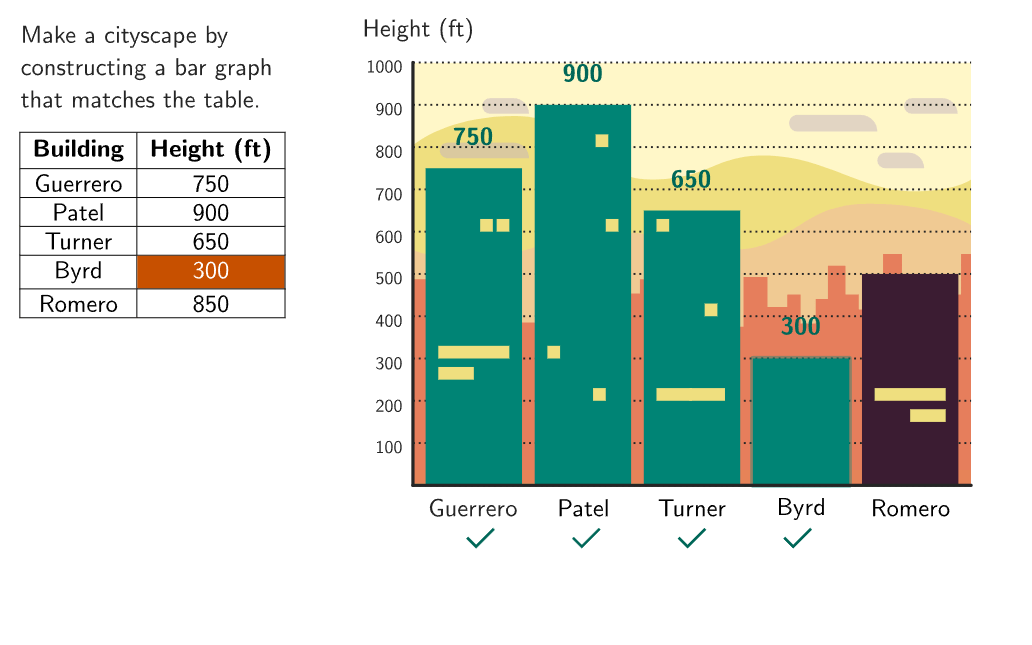
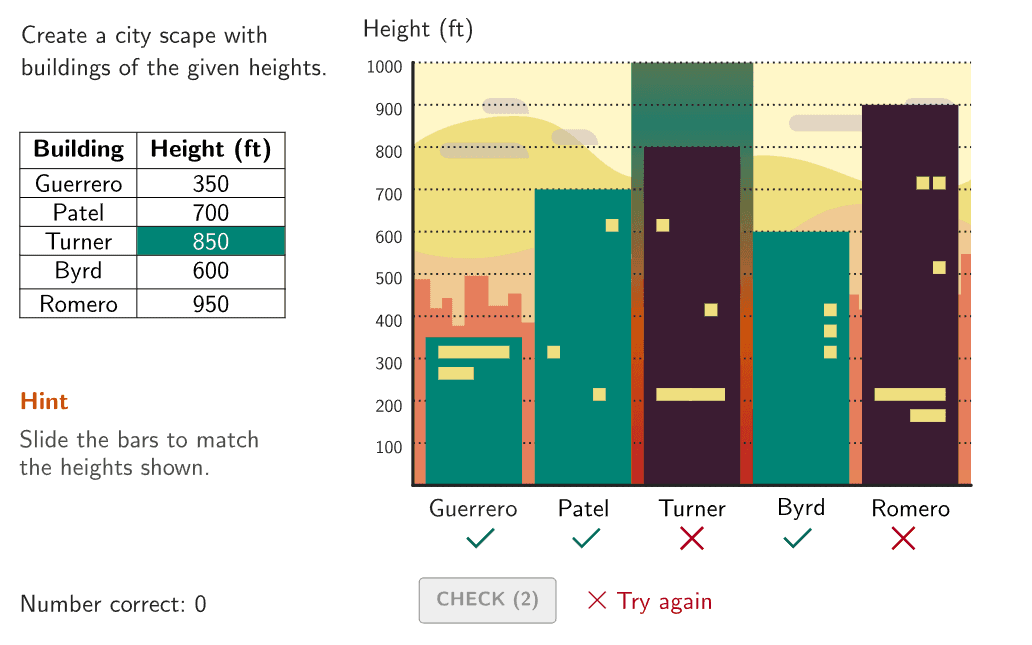
Bar Graphs
Organize, display, and interpret information in bar graphs.

Graphs with Scales That Represent Multiple Units
Organize, display, and interpret information in graphs containing scales that represent multiple units.


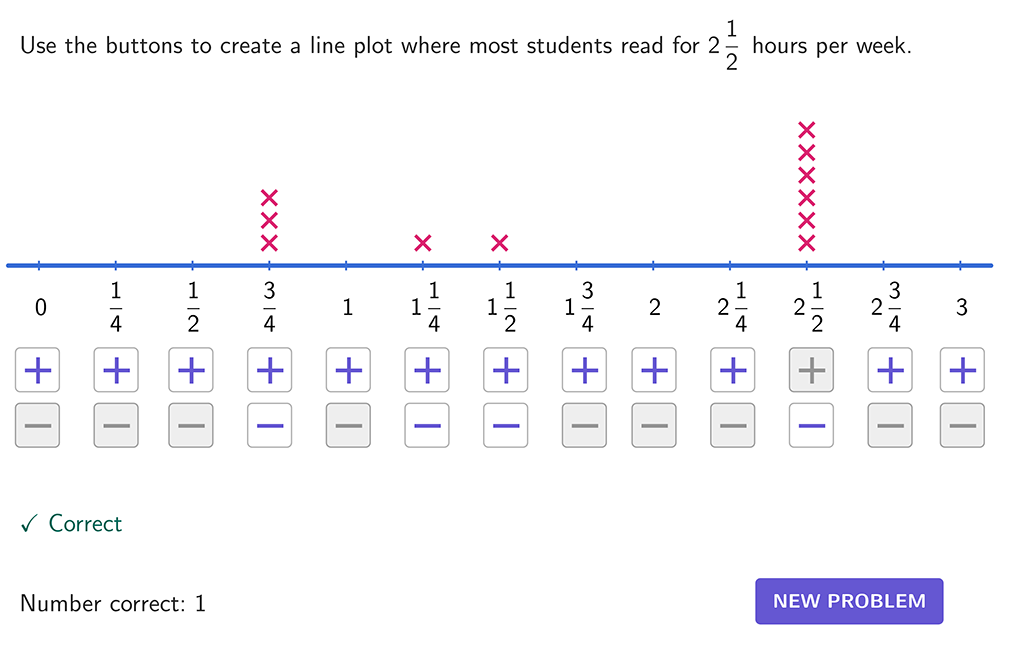
Line Plots with Fractional Scales
Organize, display, and interpret information in line plots with a horizontal scale in fractional units.
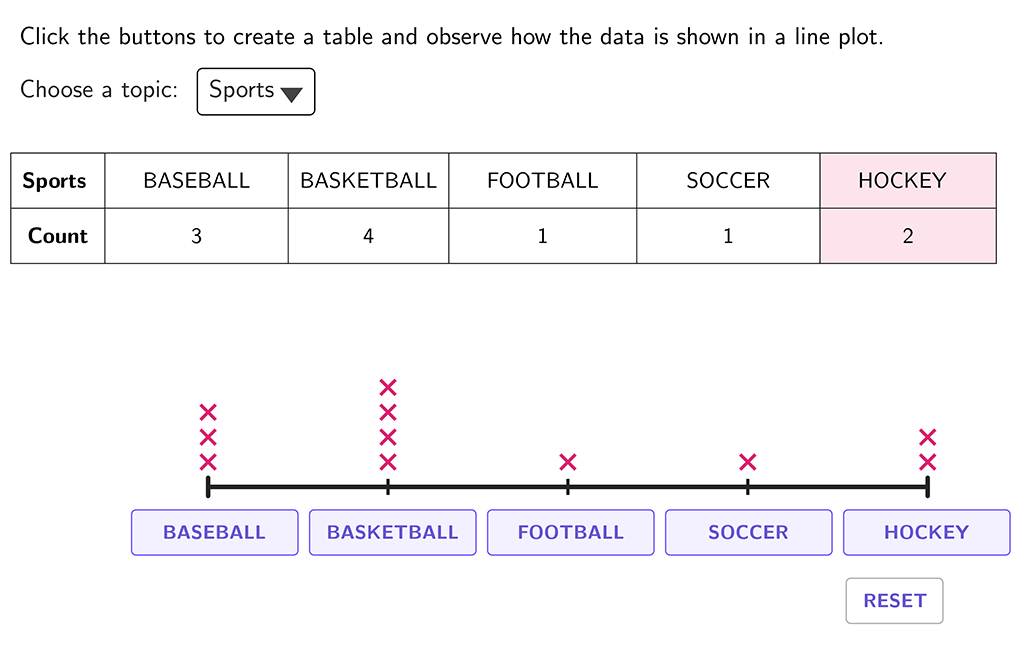
Tables and Graphs
Organize, display, and interpret information in tables and graphs (frequency tables, pictographs, and line plots).
Middle School
GRADES 6-8
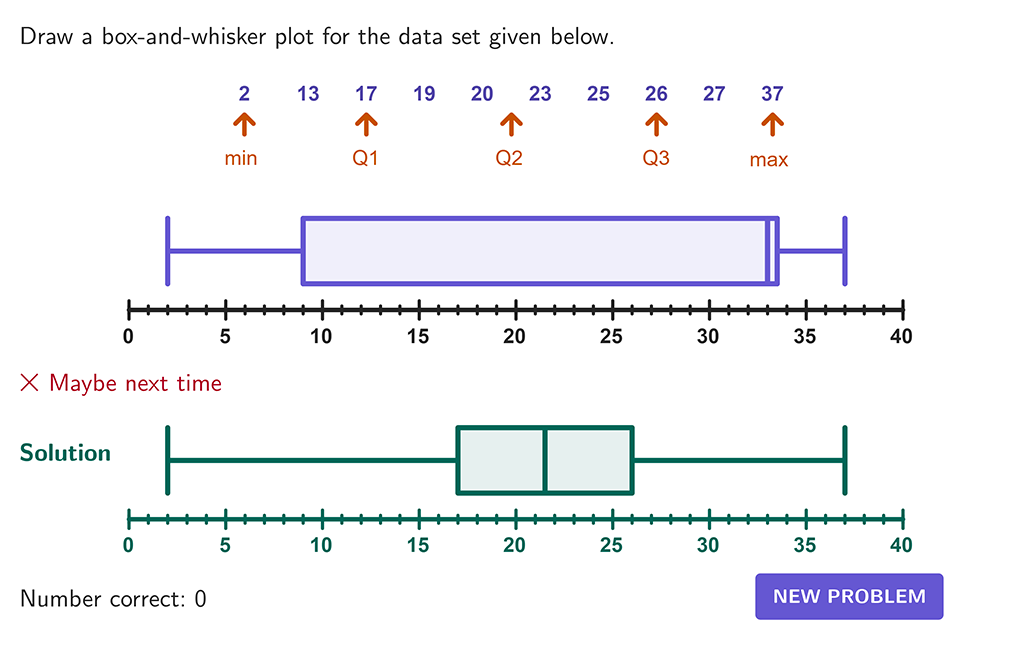
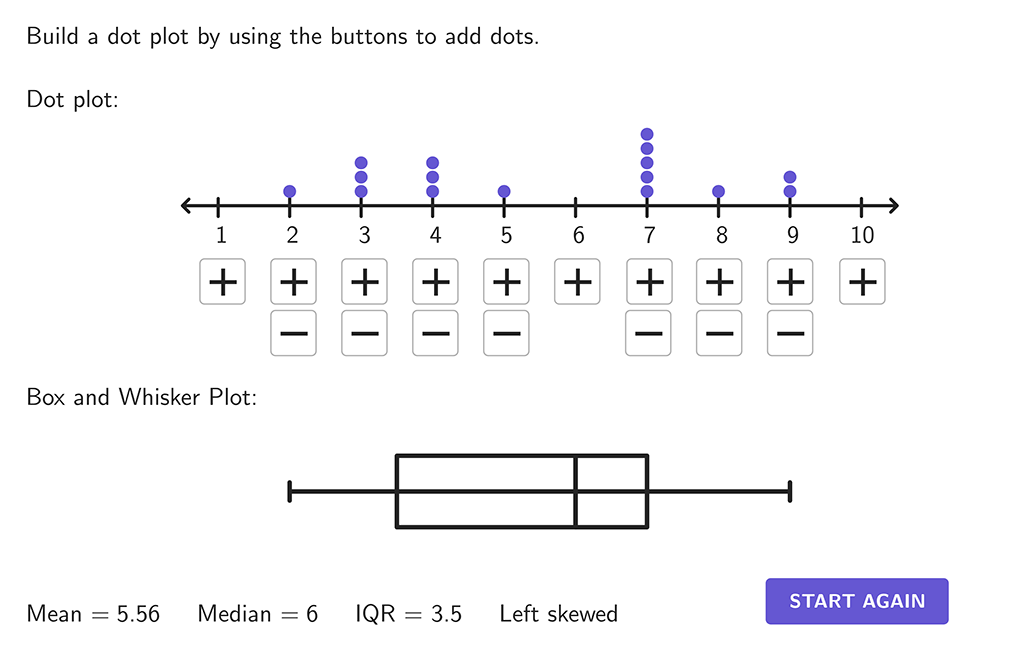
Box and Whisker Plots
Organize, display, and interpret information in box-and-whisker plots.
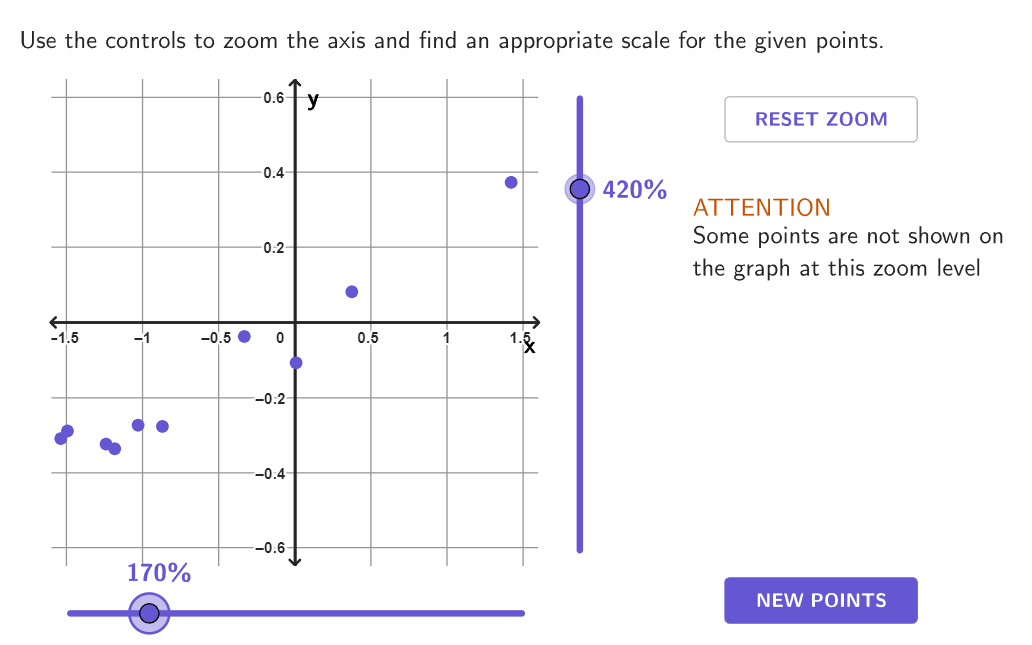
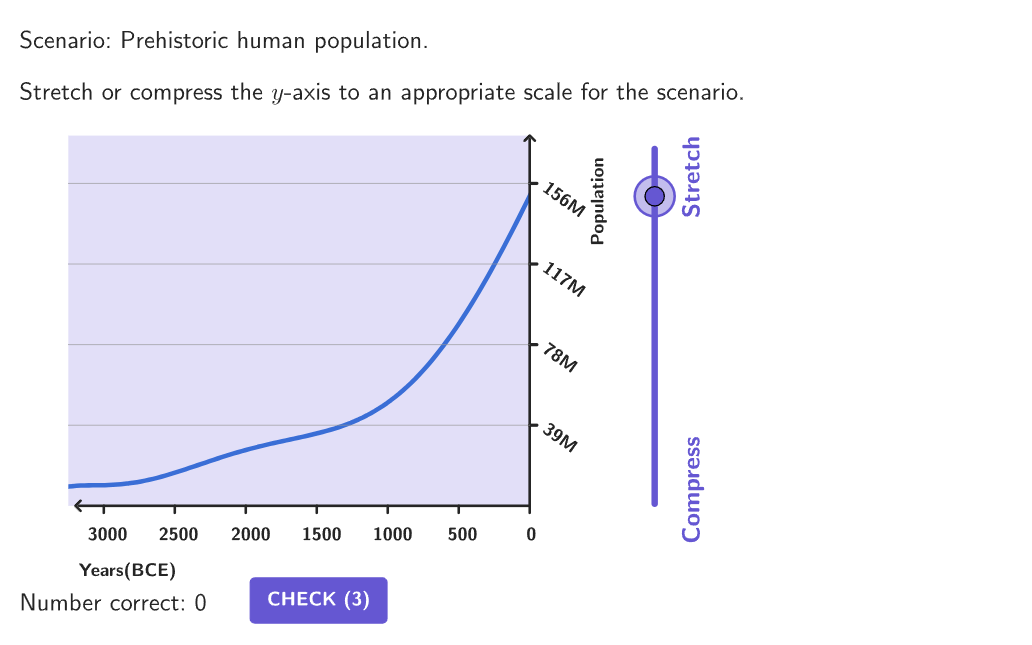
Choosing Scales and Intervals for Graphs
Identify and use appropriate scales and intervals in graphs and data displays.
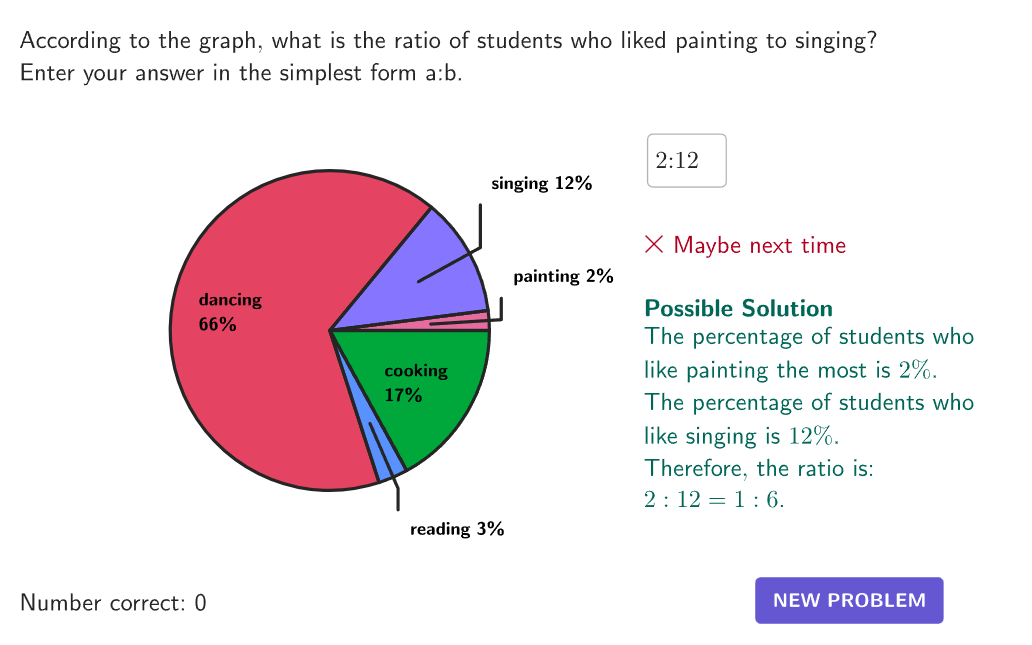
Circle Graphs
Organize, display, and interpret information in circle graphs using ratios and percents.

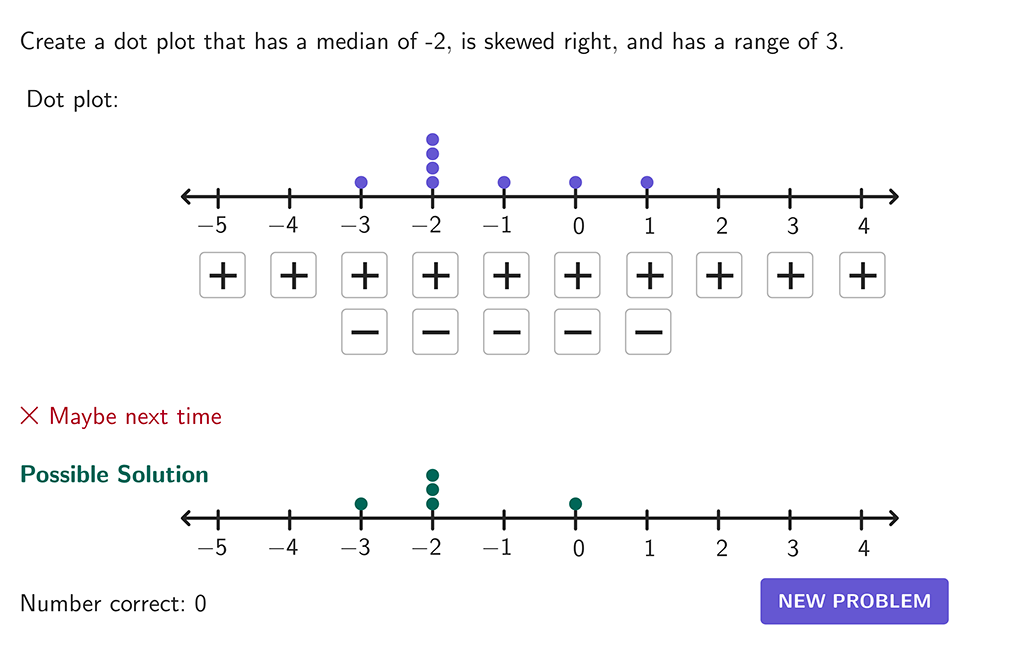
Frequency Tables and Dot Plots
Use frequency tables, dot plots, and other graphs to determine the shape, center, and spread of a data distribution.
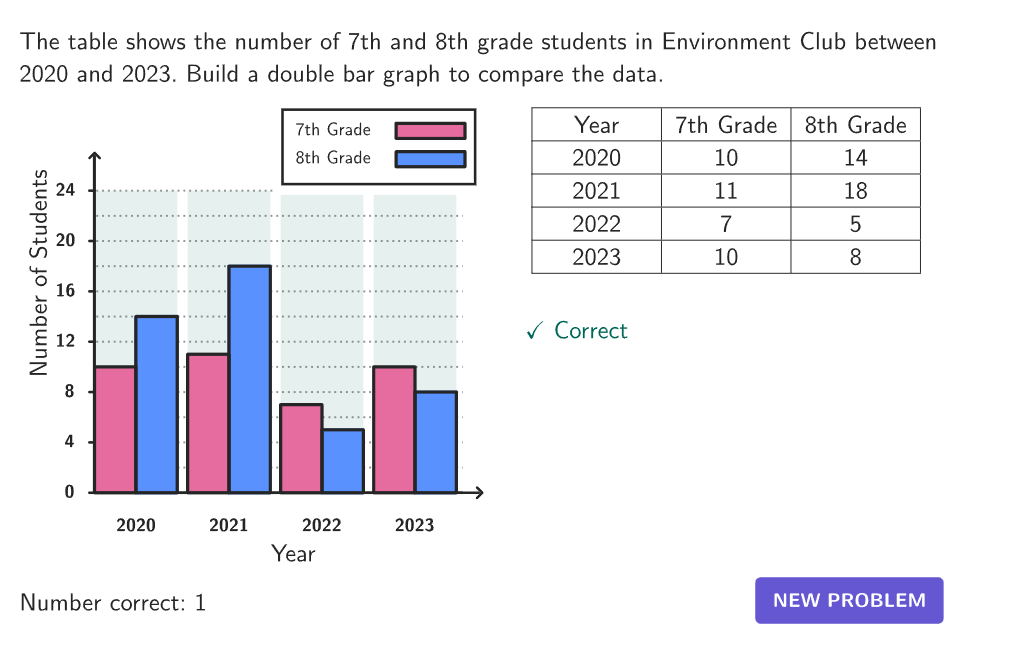
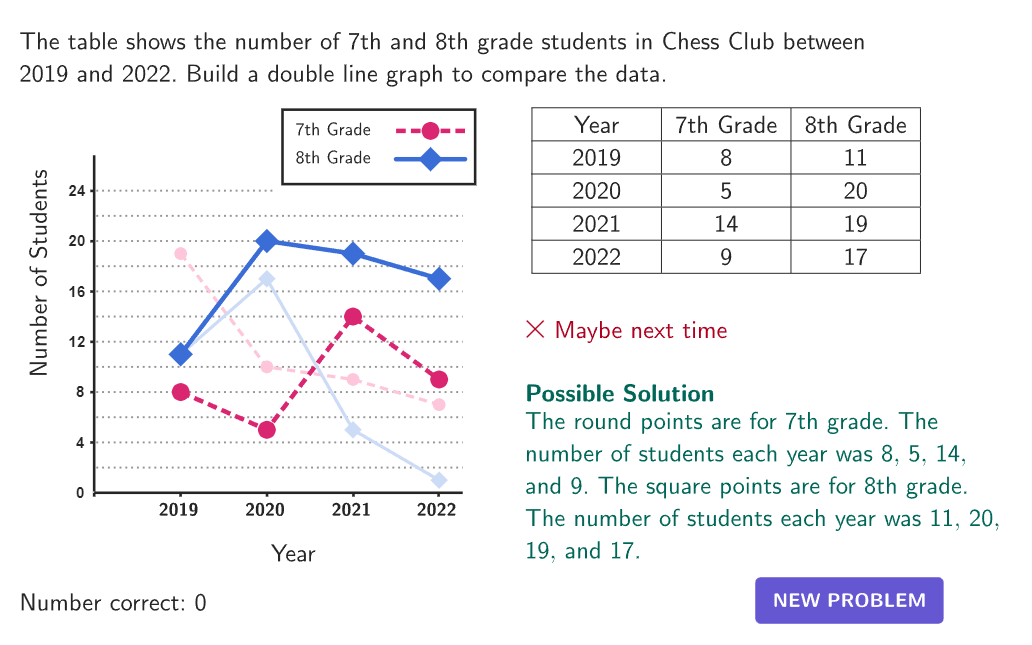
Graphs with Multiple Sets of Information
Organize, display, and interpret multiple sets of information in the same graph including multiple bar, multiple stem-and-leaf, and multiple line graphs.
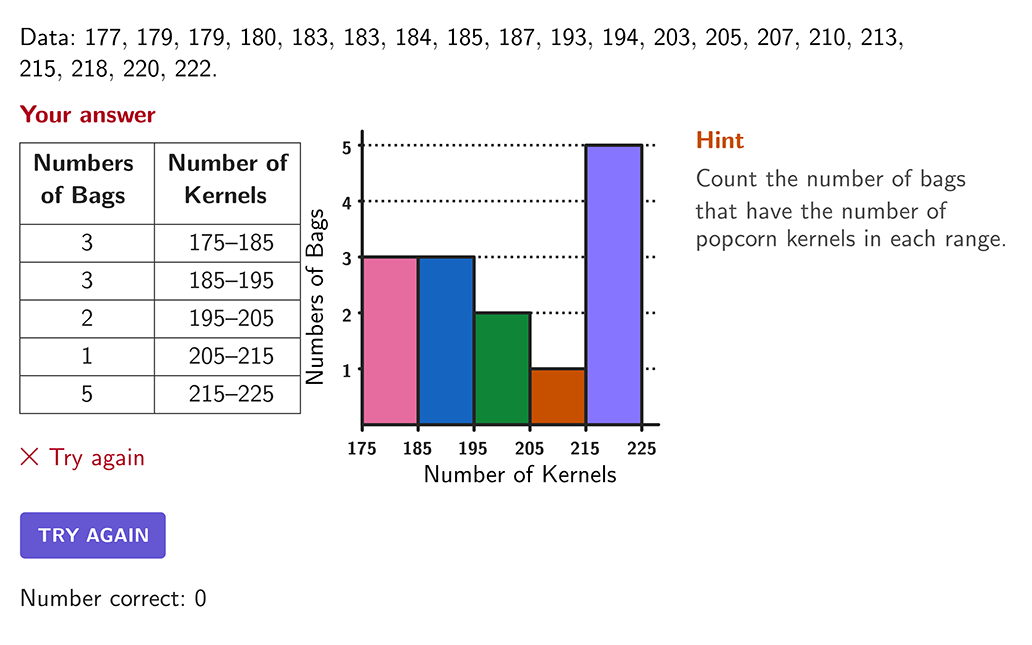
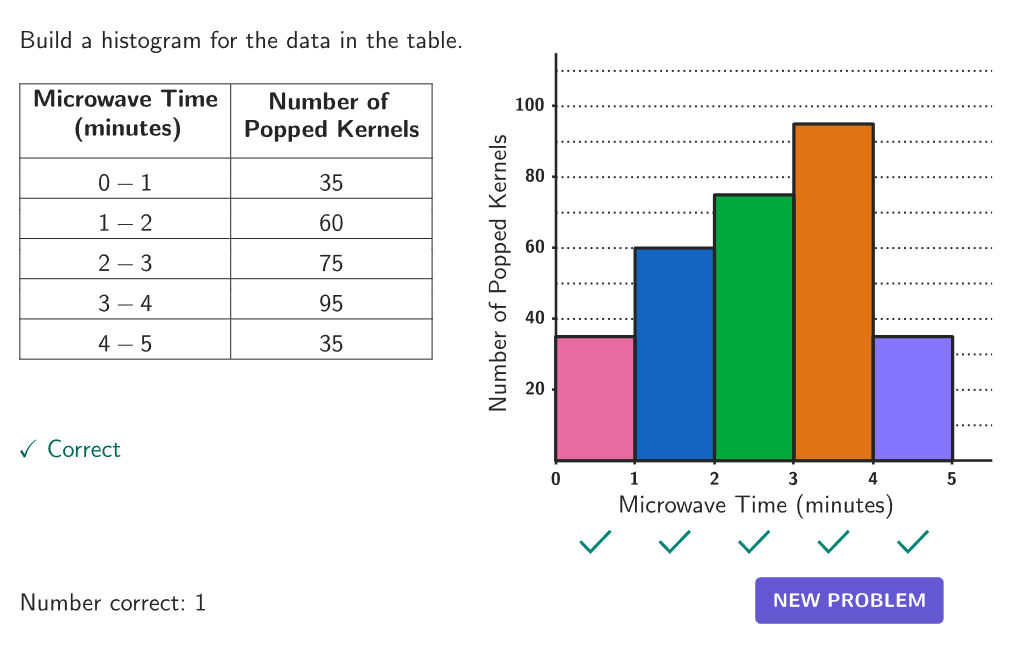
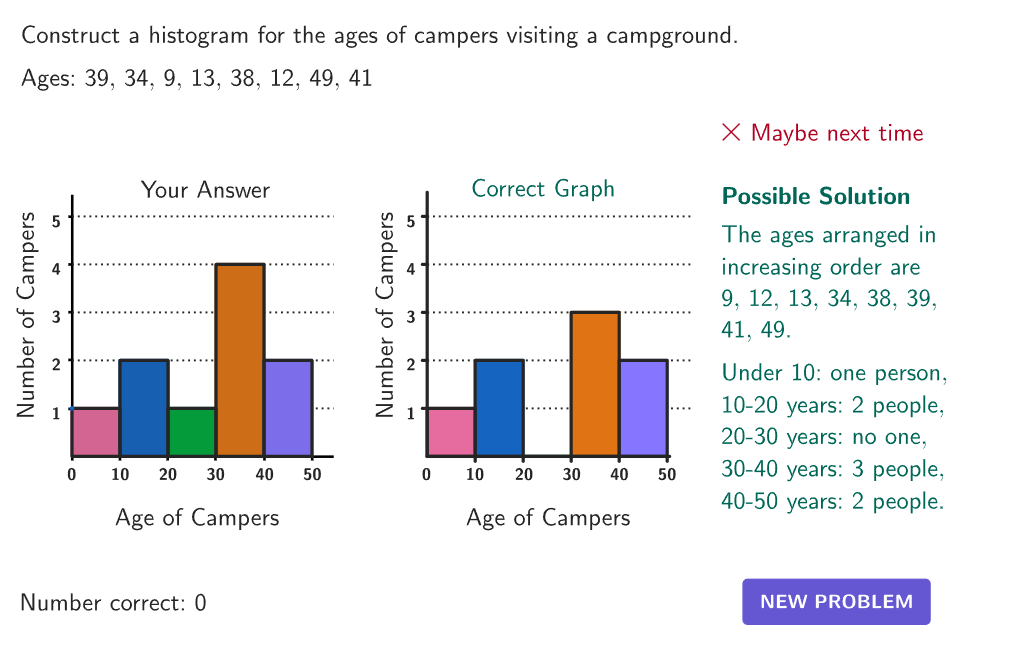
Histograms
Organize, display, and interpret information in histograms.

Histograms vs. Bar Graphs
Organize and compare one set of information in histograms and bar graphs.
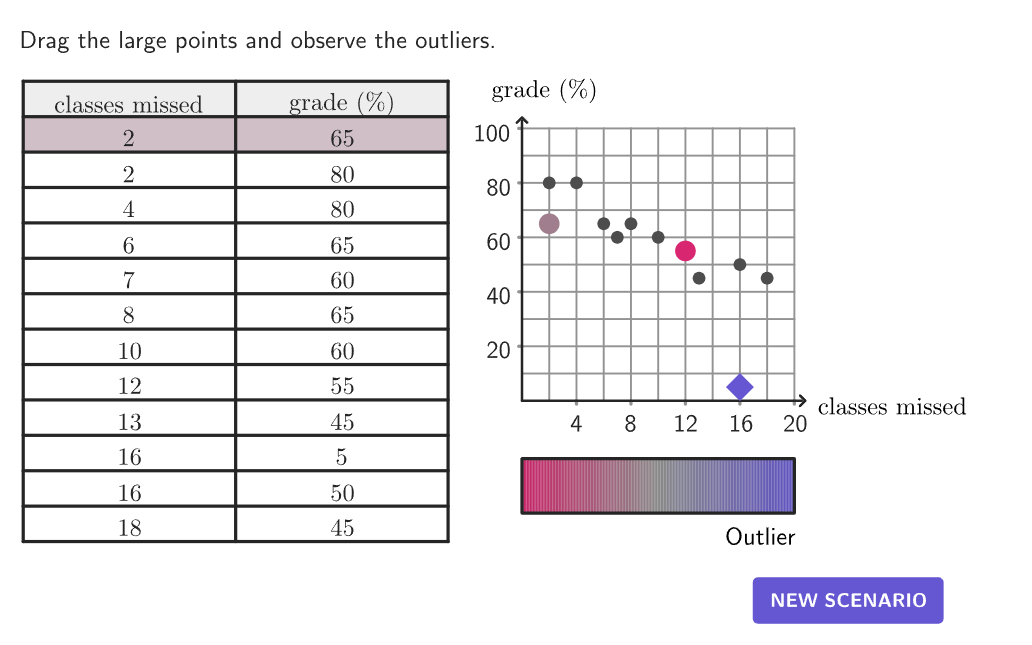
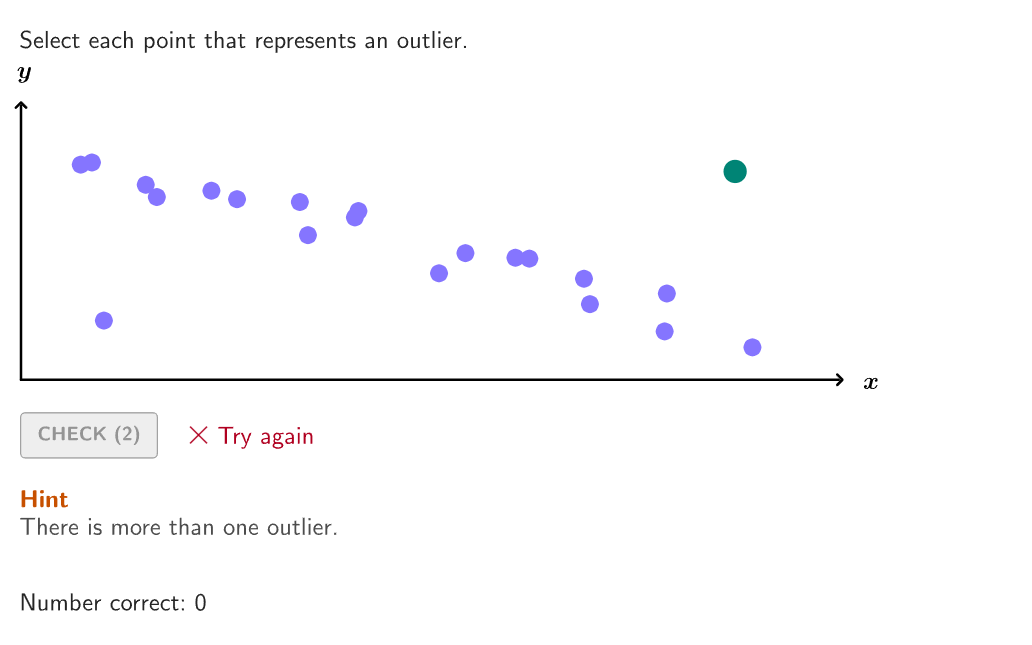
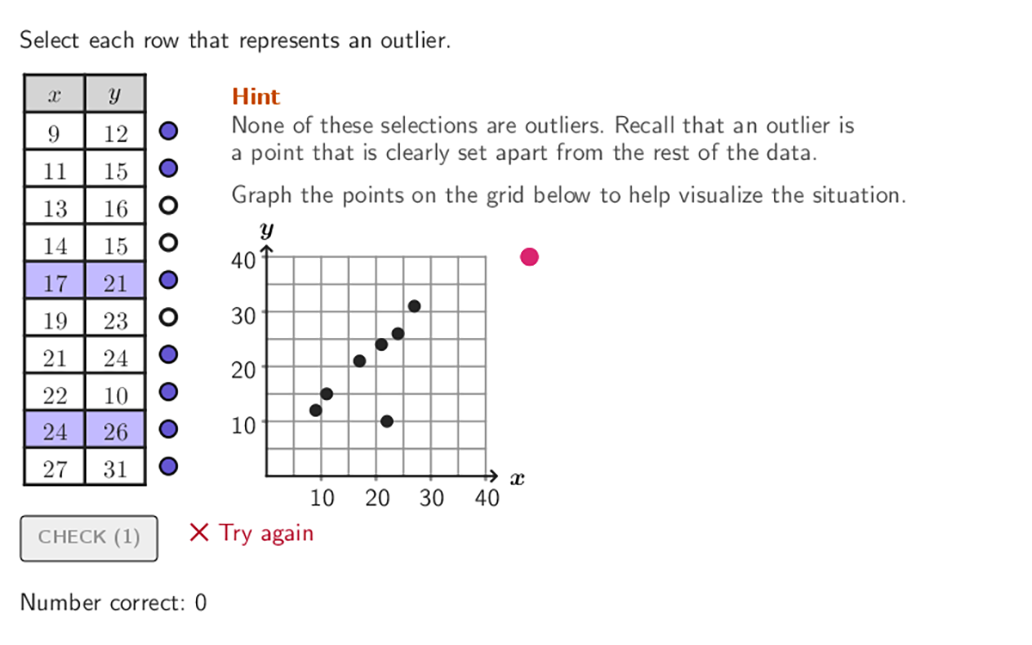
Outliers and Clusters in Scatter Plots
Identify outliers and clusters in bivariate data in tables and scatter plots.
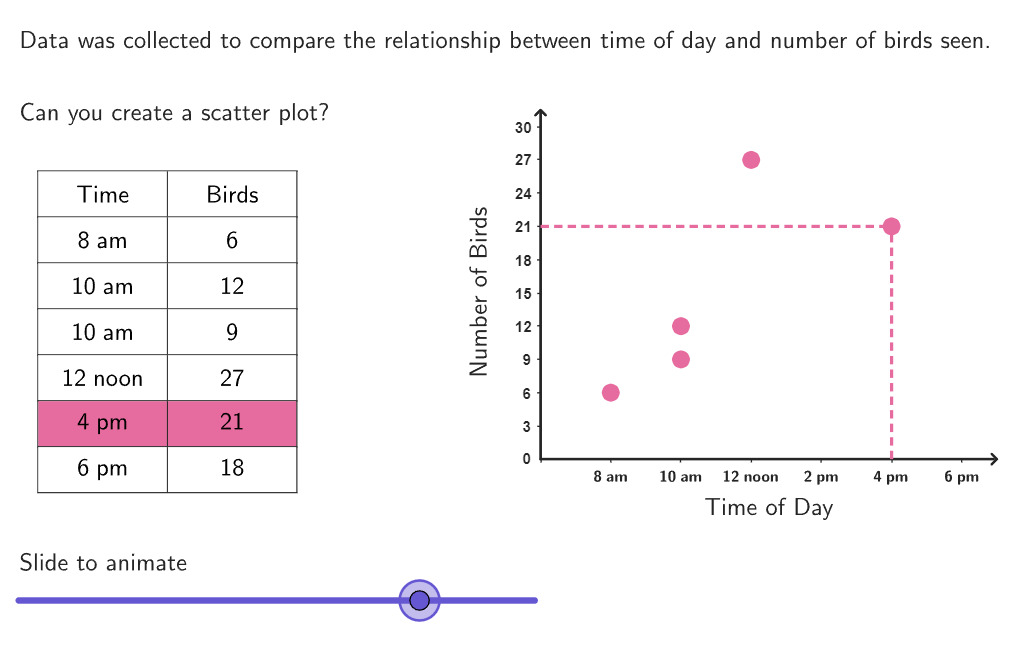
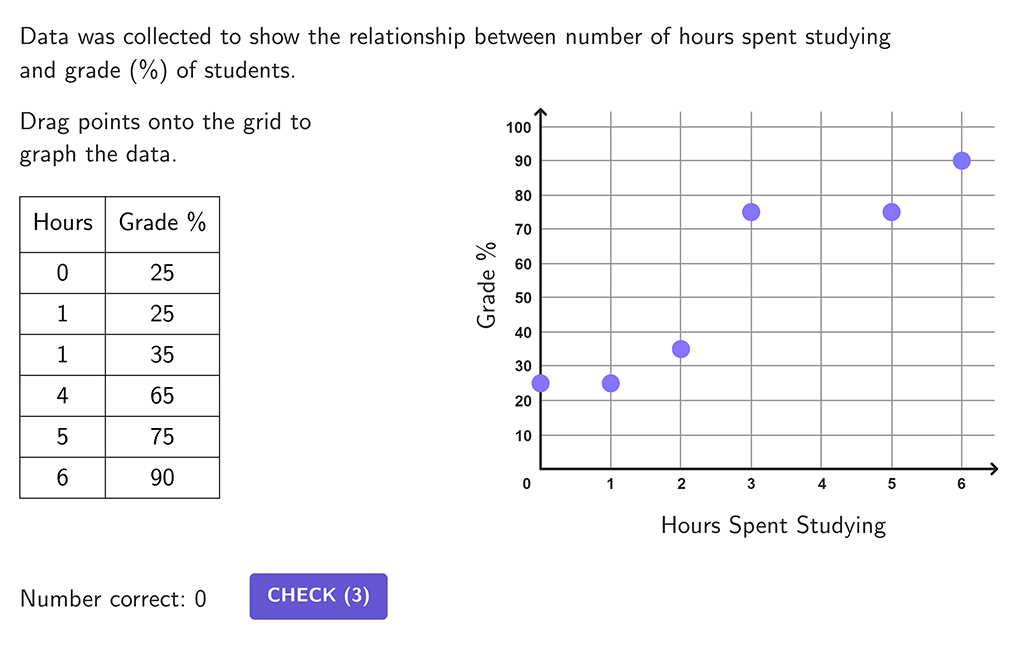
Scatter Plots
Organize, display, and interpret information in scatter plots. Approximate a trend line and identify the relationship as positive, negative, or no correlation.
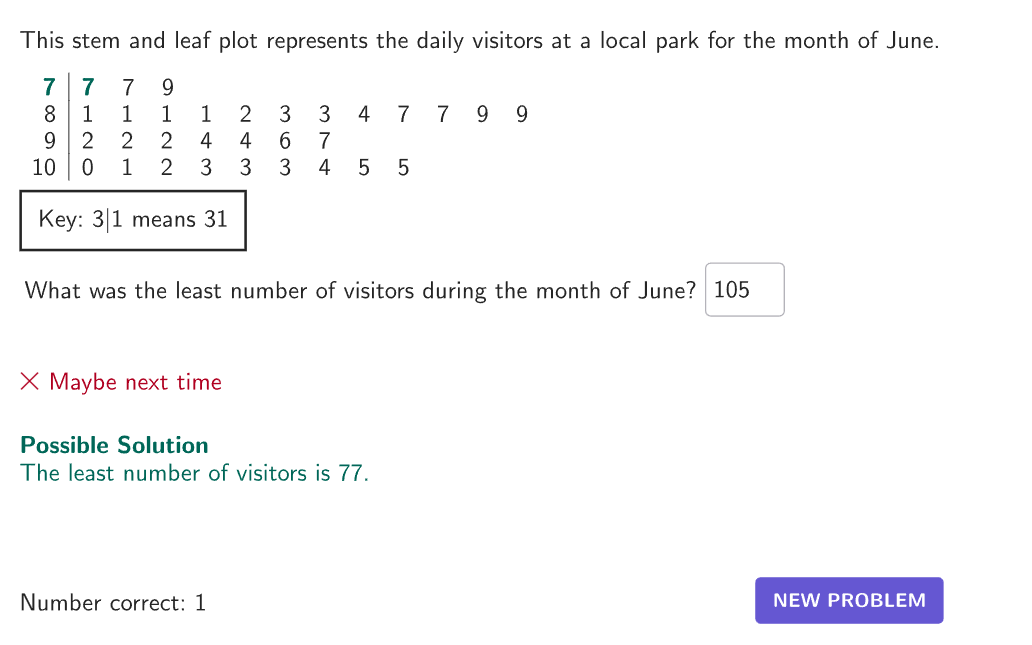
Stem and Leaf Plots
Organize, display, and interpret information in stem-and-leaf plots.
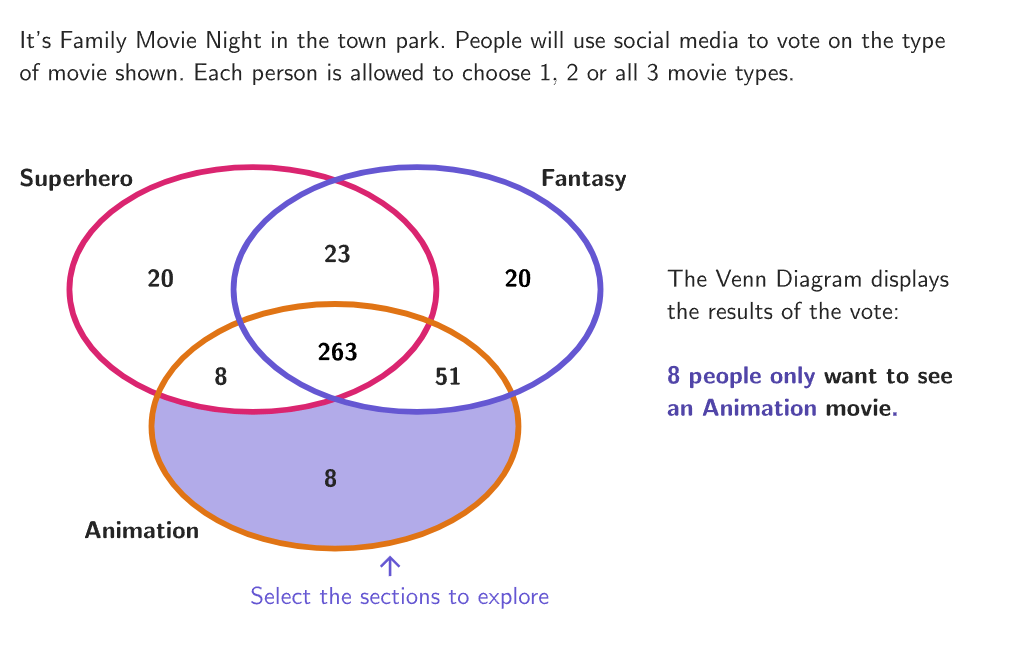
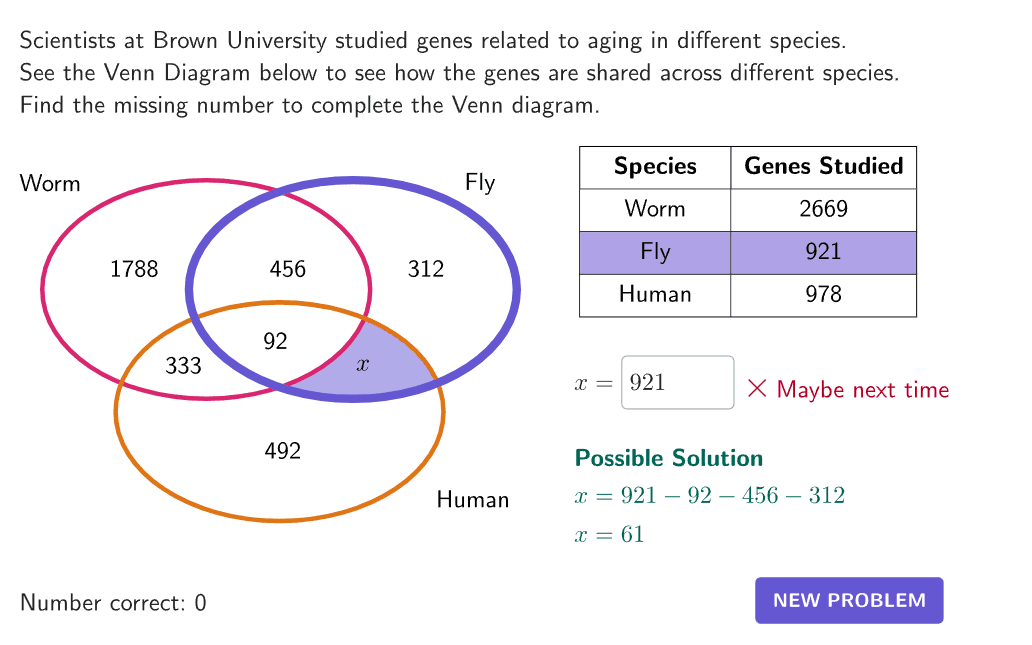
Venn Diagrams
Solve problems using Venn diagrams.
Thèmes en Lien
Ressources de la Communauté
Explorez une vaste collection de plus d'un million d'activités, d'exercices et de leçons de mathématiques et de sciences méticuleusement élaborés par notre communauté GeoGebra mondiale. Découvrez les possibilités illimitées qui y sont offertes.

Commencez à utiliser GeoGebra dès aujourd'hui
Créez un compte gratuit pour pouvoir sauvegarder vos progrès à tout moment et accéder à des milliers de ressources mathématiques que vous pourrez personnaliser et partager avec d'autres