


Creating Dot Plots
Creating Dot Plots
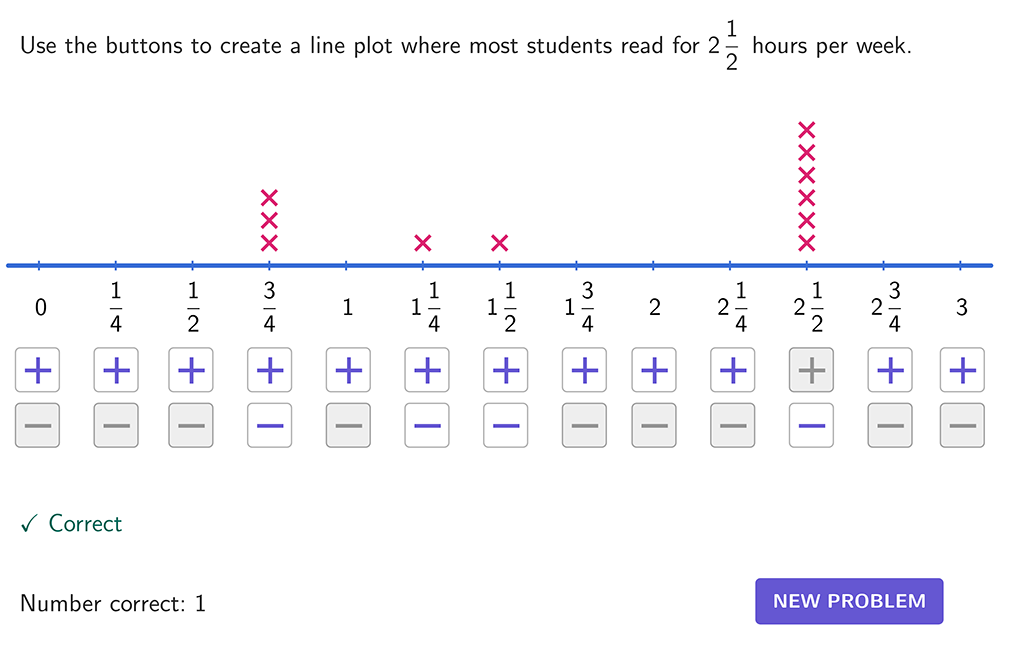
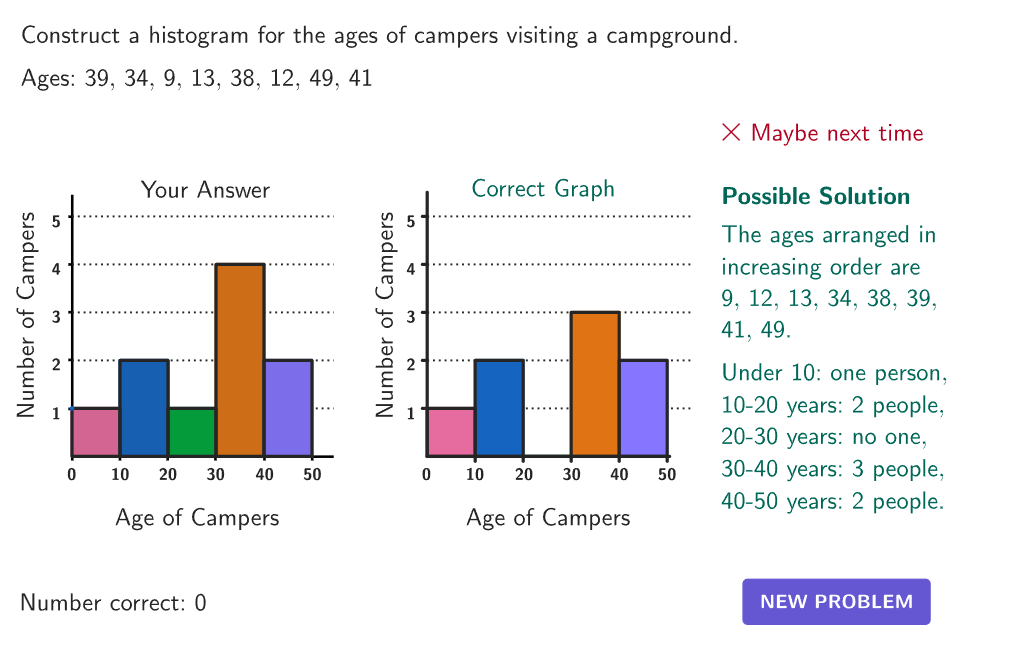
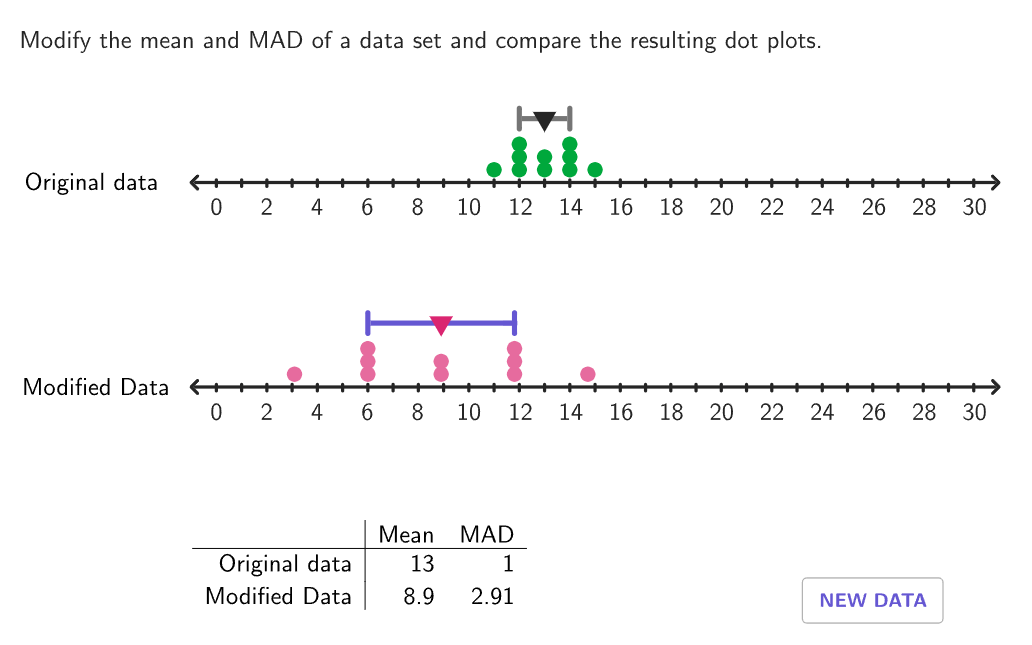
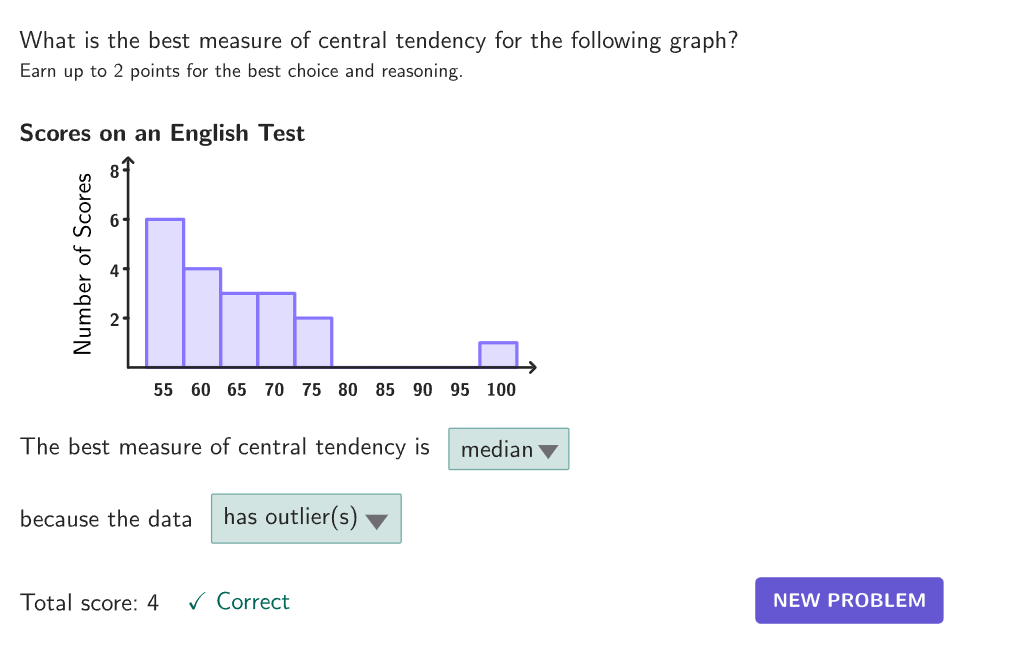
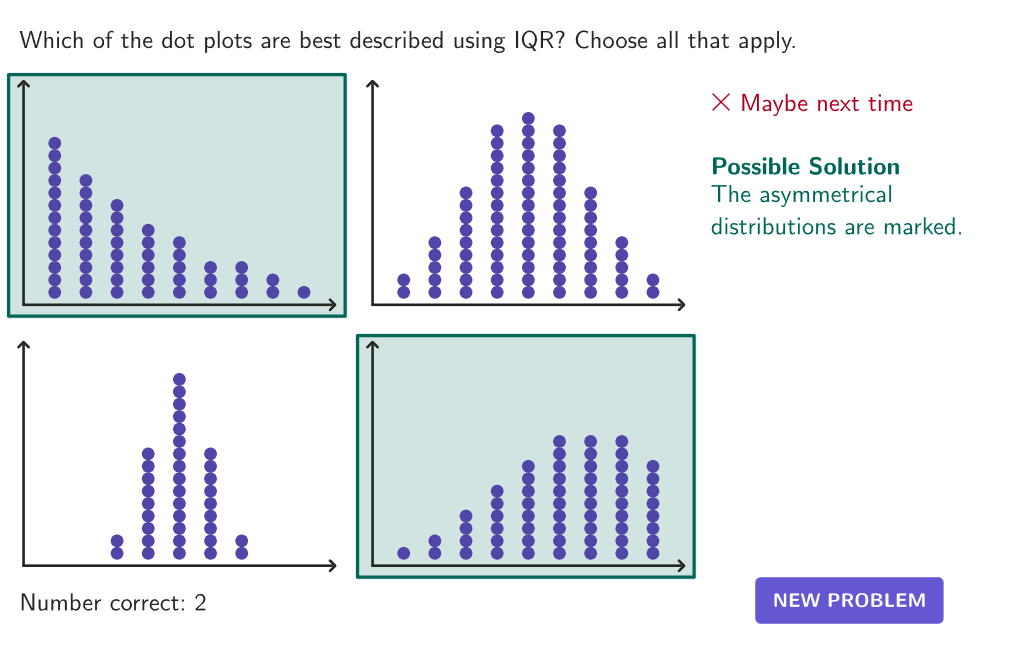
Create dot plots with given medians, shapes, and ranges in this activity
Explore more
Prerequisite Resources
More from Diagrams
Create dot plots with given medians, shapes, and ranges in this activity
Prerequisite Resources
More from Diagrams